|
BOOBOO: Why some athletes dominate some sports (or why Jon Entine is not Einstine)
RACIAL DIFFERENCES IN SPORTS PERFORMANCE
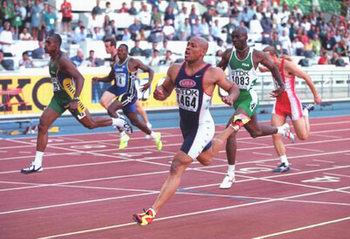
If you were watching any of the recent Olympics or World Championships in athletics, you probably weren't surprised that all the finalists of the 100 m sprint kneeling down into blocks were black. Similarly, triumphs of Africans in long distances are also expected. But white Europeans still dominate athletic throws and do well in long sprints and middle distances. Do there exist some „athletic genes“ that can explain it?
UPDATED AND REVISITED: 23. 10. 2009
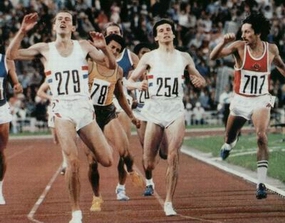
The black 100 m sprint
However, the dark skin of these runners hides a very important fact: While North American sprinters - whose ancestors come from the area of West Africa – dominate all distances up to the 400 m, they suddenly disappear in the 800 m and in the mile, they are virtually invisible. Athletic history knows no (!) world-class athlete with "pure" West African roots performing well in a distance longer than 800 metres. The performance of (a mulatto) David Krummenacker from Stockholm 3:31,93 (2002) is only enough for the 71th position in historical rankings (2009) and another athlete of West African (but clearly not predominantly West African) ancestry, Steve Holman, is not much better (3:31.52, 56th). Even the former world record holder in the 1500 m Sydney Maree is no exception, because he came from South Africa.
On the other hand, excellent endurance runners, who are of South or East African origin, are only rarely competive in the 400 m and they usually don't nominate their representatives into short sprints. This is very interesting from the view of sports physiology, because differences between sprinters and endurance runners are huge. While sprinters represent muscular types with the predominance of fast-twich muscle fibers that are not capable of long-lasting, aerobic performances, endurance runners are typically of slender, tiny, ectomorphic physiques with red, slow muscle fibers that twitch much slower, but enable work of long duration.
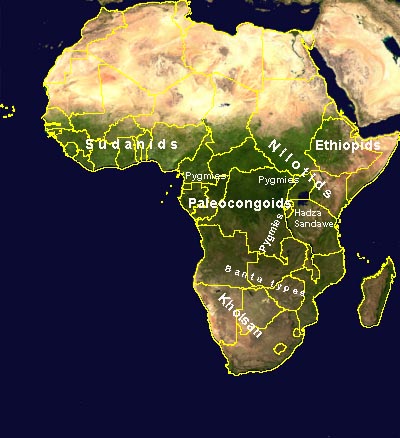
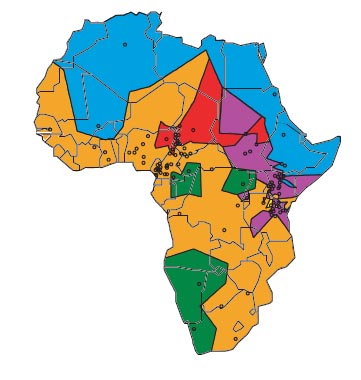
Six African races
Traditional anthropology of the first half of the 20th century distinguished roughly six basic anthropological types of Subsaharan Africans:
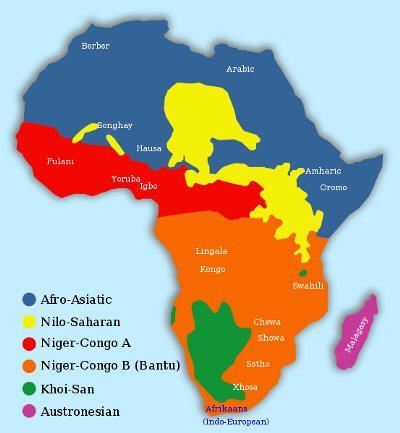
Interestingly, this anthropological division largely agrees with the linguistic division of Subsaharan Africans into Khoisan-speaking groups (including the Hadza and Sandawe), Niger-Congo family originating in West Africa, Nilo-Saharan groups in East Africa, and Cushitic groups (belonging to the Afro-Asiatic family) in Ethiopia and Somalia. The mutual evolutionary relationship of these people was not known and couldn't be established with the limited possibilities of that era. Most anthropologists regarded them simply as regional variations of the "Negroid race". As expected, leftist scientists motivated by political agenda started to refuse this division in the late 20th century.
However, modern population genetics helped to illuminate a very surprising roots of these African groups. The phylogenetic tree of Homo sapiens shows that as early as 100 000 years ago, humans splitted into two geographically separated groups: The first one, characterized by Y-haplogroup A and mtDNA haplogroup L0, obviously dwelled in south Africa and became the ancestor of today's Khoisan. Curiously, a part of these people later headed north and gave rise to modern Nilotes and other Nilosaharan groups. This is evident from the predominance of Y-haplogroup A3b2 in Nilotic groups from Sudan, and distribution of maternal L0a/LOf lineages in East Africa.
The second branch of modern humans is usually placed into East Africa; however, its oldest lineages are now distributed in the forests of West and West-Central Africa, among Pygmies, the smallest humans in the world. A certain maternal lineage of Pygmies Mbuti from north-eastern Congo (L2) is related to a branch that leaves forests and is now present in the savannah. This "savannah branch" has two further subbranches, from which one (L4) can be found in Hadza/Sandawe in Tanzania. This denies the traditional assumption that Hadza and Sandawe are related to Khoisan people. The second subbranch (L3) obviously originated in the highlands of Ethiopia, and is now present not only in East African Cushites, but also in all other humans outside Africa. This means that modern Cushites (Ethiopians, Somalis) are descendants of a human group, from which a small part once splitted and expanded to Eurasia.
This picture shows that these "Negroid anthropological types" are actually different races that separated from each other much earlier than the inhabitants of the rest of the world. A definitive confirmation of this point was brought by a study of Sarah A. Tishkoff et al. (2009). Autosomal genetic clusters documented in this study nicely correlate with the phylogenetic division of paternal (Y-DNA) and maternal (mtDNA) lineages. What does biology tell us about the body morphology of these Africans?
What scientists found
On the basis of athletic performances, we could suppose that athletes of West African origin could be genetically endowed with a higher proportion of fast-twitch muscle fibers. As stated above, there generally exist two types of muscle fibers (fast and slow) and the fast type has another two subtypes: a red, somewhat slower type IIa that prevails in 200-400 m runners and has a certain aerobic potential, and a white, fast-twitch type IIb, necessary for acceleration and performances of very short duration (5-6 sec.). World class sprinters posess about 70-80% fast-twitch muscle fibers. On the other hand, endurance runners can have as much as 90% of the I type. The proportion of muscle fibers is largely genetically determined and can be influenced by sports training only to a certain extent. (It is well known that white IIb fibers represent a "default" fiber type and easily convert into the IIa type during training with some aerobic component. However, conversions IIa > I or I > IIa are not easy.) Further, studies comparing distribution of muscle mass showed tendency towards better development of limbs in African-Americans, especially the muscle of thigh and buttock. The "anterior pelvic tilt", i.e. high buttocks in black Americans, is a typical feature of many sprinters, because it enables a better angle for generation of power during sprinting. In contrast, in European populations it is less common and in Asian men it is almost absent.
First of all, let's look at practical tests that were done mostly in the United States during the last century. Do they confirm the "natural" sprinting and jumping talent of black Americans? Yes, quite convincingly. Dr Robert M. Malina from the Michigan State University collected a very extensive material based on studies of motoric development of the African-American and the white population between 1938-1976. Even over such a long time, young African-Americans have showed better results in sprinting and vertical jump (7 out of 8 studies) and long standing jump (in 6 out of 10 studies). Dr David Hunter from the Ohio University studied differences in anaerobic performances between black and white males aged 16-17 years matched for height and weight. Although he found no differences in the maximal power output during the so-called Wingate test (a laboratory test on a cycle ergometer), when the results were expressed in W/kg body weight (12.65 W/kg in blacks vs. 12.62 W/kg in whites), the blacks subjects generated more absolute power (885 vs. 862 W) and there were clear differences in performances of the "real world", i.e. 40 y dash (4.81 vs. 5.03 sec.) and especially in vertical jump (56.2 cm vs. 50.7 cm). Although the results were distorted by a higher % of fat in whites, the differences didn't disappear even when the fat percentage was statistically removed.
Laboratory studies agree with these findings. In 1986, a team of Canadian scientists from the University of Quebec led by dr Pierre Ama examined differences in muscle fiber proportion in thighs of 23 white Canadians and 23 black Africans from Cameroon, Senegal, Tchad, the Ivory Coast, Zaire and Burundi. The muscle of Africans really contained higher ratio of the fast-twitch muscle fibers (67,4 vs. 59,1 percent=8,3% difference), but the difference in the proportion of the IIb type was quite small (19,7 vs. 17,1 percent). However, West African subjects had 50% higher activity of anaerobic enzymes involving in work of short duration. A study done at University of Tennesee in 1997 found similar trends between 14 white and 14 black college students, but the difference was smaller (60,5 vs. 55,1 percent=5,4% difference), which could – in theory – result from the above mentioned admixture of white genes in the black American population (in my opinion, the sample was not perfectly representative, which was apparent from the unusually low difference in aerobic capacities between the two groups). In summary, the research shows that ïnterracial differences of this sort may exist, but they are not too much higher than usual sampling error (8%). When we also consider the huge interindividual variability in the muscle fiber proportion in humans, the difference in sprinting ability should not be abyssal. There is everytime a big overlap of individual capacities. However, as the practical tests shows, average differences are clearly visible and when we will be getting towards the extreme sprinting ends of the bell curve of both populations, where Olympic sprinters in the 100 m are recruited from, the number of potential black talents will get disproportionately bigger and bigger, while the number of potential white champions will get smaller and smaller.
One thing is worthy of note, howewer: The average distribution of fast-twitch fibers in blacks (ca. 65%) would correspond to an average 200 m runner, while the average distribution in whites (usually 55% or slightly higher) would fit into a hypothetical 600 m distance. Although we can take some anatomical advatages of West African blacks into consideration, the interracial difference in the 400 m can't be large, and certainly not as large as the current stats suggest. Around 2000, it would seem foolish to suggest that white runners possess a similar talent for the 400 m like blacks; yet the historical stats before 70's and the current emergence of white quartermilers in USA indicate that this is indeed the case. In fact, what we now see in the 400 m is a classical example of a psychologically determined sport socialization: The 400 m was taken as a sprint, and hence automatically as "a black discipline" that whites should avoid.
But why is there such a sudden break between the 400 and the 800 m? Aren't these West African runners only "lazy"? However, this phenomenon can be easily explained from the view of sports physiology. After 1 minute of intense muscular work the ratio of aerobic and anaerobic energy changes very dramatically. While a quarter miler obtains 70-75% of all produced energy by anaerobic ways, a half-miler produces 50-62% of the energy for running aerobically (from glucose oxidation), and a miler as much as 70-80 percent. West African populations obviously hit biological limits: lower number of slow-twitch muscle fibers that produce energy during long muscular work, lower capacity of the cardio-respiratory system (15-20 percent lower lung capacity, 5-10% lower VO2 max., lower concentration of hemoglobine), lower muscle capillarization and thus generally lower aerobic fitness. In the 400 m you still can run at high oxygen debt, but in longer races it is impossible without "breathing". Notoriously known weak endurance capabilities of the African-American population are repeatedly confirmed in various tests of resistance to fatigue and aerobic ability.
The mystery of East African runners
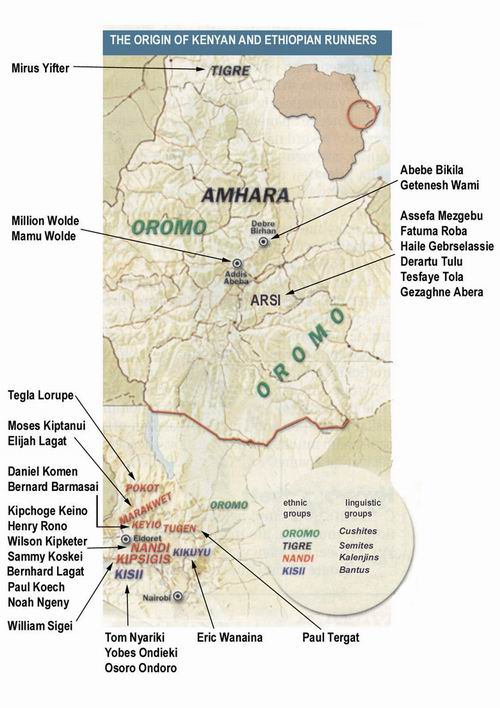
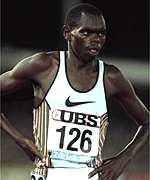
While Nigerians, Ghanians or African-Americans are one of the worst endurance runners in the world, the opposite is valid for the inhabitants of North, East and South Africa – and especially for Kenyans. People from this country started to compete internationally in the mid 60's, and their first success came at the Olympic Games in Mexico City 1968, when they won 7 medals from the 800-marathon. Since that time, their collection of athletic medals and other international honours has grown almost astronomically. They achieved a legendary success especially at the Olympics in Soul 1988, where they won at all distances from the 800 m to the 5000 m. Kenyan runners currently make up roughly one half of the best all-time competitors from the 800 m to the marathon. However, it is only a little known fact that athletic talent in this country is not evenly distributed. Nearly three quarters of the Kenyan international success is produced by runners coming from a 3-million population of the Kalenjins, forming only about 12 percent of the Kenyan population. It is interesting that even among Kalenjins the distribution of sports tailent is not homogenous: One of the six major tribes, called Nandi, having only about 500.000 people, contributes to the international triumph by one half. At the same time, other parts of Kenya by far don't produce such a number of excellent athletes.
Surprisingly, a similar situation exists in neighbouring Ethiopia, where the majority of the world-class athletes comes from the Cushitic Oromo tribe and a disproportionate number of them was born in a mountaineous province Arsi, south-east of the capital Addis Abeba. Together with a neighbouring province Shewa, this part of Ethiopia encompassing 15% of the Ethiopian population produces about three-quarters of its best runners.
The research of endurance runners is complicated by a wider number of factors that determine performance. The most important of them are the so-called maximal oxygen uptake (VO2 max. or the maximal amount of consumed oxygen that can be utilized by the body for energy production, which is limited especially by cardiac output that distributes oxygen from the blood to working muscles), running economy (economy of oxygen consumption resulting especially from anthropological parameters like physical slenderness or thin legs) and physiology of skeletal muscles determining the so-called "lactate threshold", i.e. the percentage of oxygen consuption or speed at VO2 max., when lactate begins to accumulate in the runner's blood and soon or later causes inhibition of muscular work. Lactate threshold depends on a variety of factors including % of slow fibers, the amount and density of mitochondria, oxidative enzymes, capillarization etc. While VO2 max. sets the upper limit of aerobic energy production, running economy and lactate threshold determine, how this upper limit will be utilized.
Differences between Kenyan and white runners were studied by the team of dr Bengt Saltin from the Danish Institute of Sports Sciences in Copenhagen. The Danes didn't find any fundamental differences in the composition of muscles (about 72,5 percent of the slow fibers in Kenyans and something below 70 percent in Scandinavians). Further, senior Kenyan runners had more blood-carrying capillaries in their thighs, but Kenyan juniors had less density of capillaries than Scandinavians, which can be explained by their more intense training.
However, although Kenyans - on the average - had neither higher levels of hemoglobine in the blood, nor higher VO2 max., some of them reached higher values of VO2 max. than the best Scandinavians (as much as 85 ml oxygen per kg of body weight in minute). This may result from their active living style in altitude enhancing capacity of the cardiovascular system. This was apparent, when the scientists measured VO2 max. in town boys, who had values between 47-52 ml/kg.min and 45% slow-twitch fibers (practically the same numbers like in European contemporaries), but village boys, who usually run or walk to school, reached 56-62 ml/kg.min and had 52,5% slow-twitch fibers in their thighs. Some teenagers that just started regular training had even 80 ml/kg.min, which is absolutely extraordinary for this age. However, in general, VO2 max. couldn't be the solution, because such high values can be found in top European runners as well. The biggest difference was in the body type: Kenyan runners were smaller, lighter (170-175 cm/55-60 kg), had very slender, „bird-like“ legs and very long, extremely thin levers. These anthropological characteristics enabled them to „fly through the running motion“ much easier than it was in Danes, who „pulled heavily into the ground“. No wonder that Kenyans ran ca. 5-15% more economically, which means that they consumed less oxygen at a given speed. Further investigation ("The Kenya Project") confirmed these differences even in previously untrained adolescent boys, who passed a running training and subsequently were compared to similarly trained young Danes. Again, there were no differences in VO2 max. and lactate threshold, but the young Kenyans achieved 10% better time due to 10% better running economy.
A more detailed analysis revealed that this running economy is mainly caused by their slender calves. The Danish researchers actually discovered something that had been already discovered: The further a leg segment is distant from the axis of motion (hip joint), the more his weight influences running economy. A study done in mid 80's (Myers, Steudel 1985) showed that 3,6 kg added on the waist worsened running economy by 3,7%, but the same weight placed on ankles (2x1,8 kg) increased oxygen consumption by huge 24,3%!
Taken together, it doesn't seem that East Africans possess any mysterious running tailent. The key to their success seems to lie almost entirely in their better running economy. The rest of their performance (high lactate threshold and VO2 max.) is achieved by immensely hard training or by their active living style, respectively. (No surprise for those, who already emphasized it earlier.) On the other hand, influence of altitude or mountaneous terrain can't be excluded due to the fact that there exists practically no world class Kenyan runner from coastal lowlands. At least for the purpose of training, the Kenyans from highlands must benefit from it. But what's behind the discrepancy between the running achievement of the Kalenjins and the rest of Kenya? The Kalenjins theirselves deny that the Nandis would be somehow exceptionally gifted for running. Their dominance may simply result from their longer running tradition created by the first Kenyan Olympic winner Kip Keino. This assumption can be supported by the recent emergence of other Kalenjin tribes like the Marakwets (Moses Kiptanui) or the Keyios (Daniel Komen, Bernard Barmasai). In spite of it, some genetic factors can't be excluded. For example, at the most known high school that has become famous thanks to upbringing young sports tailents, St. Patrick's High in Iten, 18 out of 25 studying running hopes were related to some of the top athletes. Is running talent somewhat inherited within certain families? Moreover, many authors that studied living style of African runners deny the traditional theories that Kenyan running stars had run to school during their childhood. For example, Haile Gebrselassie really ran to a school 10 km far, but his most serious competitor, Kenyan Paul Tergat, walked to a school that was 800 meters from his home.
Studies of runners from Ethiopia and South Africa
Besides Kenyans, the second African powerhouse of long-distance running is Ethiopia. In fact, during the last decade, Ethiopians not only matched, but even outclassed Kenyans in distances from the 5 km to the marathon. Do they benefit from the same physical advantages like Kenyans? It is interesting that they excel in the 5-10 km, but not in middle distances, which could suggest that they may be even slimmer than Nilotes. A study of Spanish physiologists led by dr. Lucía (2006) compared Spanish long distance runners with their Eritrean counterparts with similar times. The Eritrean runners had lower VO2 max. (74 ml/kg.min.) than Spaniards (78 ml/kg.min.), and were of equal height (ca. 173 cm), but they were much lighter and possessed 13,5% better running economy, which easily counterbalanced their 5,4% deficit in VO2 max. and a substantially lower anaerobic (ventilatory) threshold. Again, the scientists found a clear relationship between calf girth and running economy.
Although less internationally successful than Kenyans or Ethiopans, black South African runners seem to be clearly superior to white South Africans in long distances. The reason of their dominance was repeatedly investigated during the last decade since 1989. The key finding was that black runners are significantly smaller and lighter than their white counterparts (168-172 cm/56-59 kg vs. ~181 cm/~70 kg). This is a part of explanation for their success, because they were more economical than whites in tests on a treadmill. But that's not everything. The black runners had surprisingly low values of VO2 max. (much lower than whites, only ~70 ml/kg.min.). This finding was confirmed in every study that measured this factor. So why were they so much better? The reason lies in peculiar physiological characteristics of their muscles. The black runners have quite a high percentage of fast-twitch fibers (not much less than 50%), which is very unusual for a long distance runner. However, despite that they had very high lactate threshold and extremely high activities of oxidative enzymes that correlated with their resistance to fatigue. Scientists still debate, if these elevated enzyme levels are a result of more intense training of Africans in altitude or some genetic response to this training. One study documented this feature even in black runners, who lived and trained at sea level and untrained control subjects from the same region had the same activity of these enzymes like white South Africans. This reasearch thus shows that these higher levels of enzymes may not be genetically determined and may not result from training in high altitude. In any case, it seems that aboriginal South African endurance runners also strongly rely on anaerobic metabolism. The unusually high percentage of fast fibers is accompanied by high activity of an enzyme called phosphofructokinase (PFK), whose activity is usually lowered in distance runners. This is obvious from the fact that the level of this enzyme in black and white control subjects was almost the same, while in the white runners it was much lower than in the black runners. The researchers speculate that this shift towards anaerobic metabolism may reflect higher running speed of black South Africans during intense trainings. However, it is interesting to note that an ethnic group called Xhosa that produces the highest number of South African long distance runners, is basically a balanced mixture between local Sans and Bantu tribes. This could perhaps illuminate the strange combination of aerobic and anaerobic adaptations.
Natural talent may not be the whole story
The table below illustrates the current anthropometric values of European and black (South+East African) finalists in middle distance and long distance events. At first sight, the body type of the modern 5000/10 000/marathon athlete almost perfectly copies the body dimensions of an average East African. Today's white 5000-10 000 m runners are markedly (+8 cm) taller than Africans, but surprisingly, they seem to be noticeably slimmer (lower BMI, higher ectomorphy). In the 10 000 m, very few runners with the height above 175 cm can be found both in Africans and non-Africans. Yet the height of African middle distance runners is strikingly different, much bigger than the usual East African average (slightly above 170 cm). The same trend can be observed in white middle distance runners. The bigger body size of 800/1500 m runners results from the fact that middle distances are still largely anaerobic (800 m: 38-50%, 1500 m: 20-30%). In running, body size and step length namely corelate with the total anaerobic power output. Obviously, the genetic predispositions of East Africans by far aren't the same for all distance events and things will be more complicated.
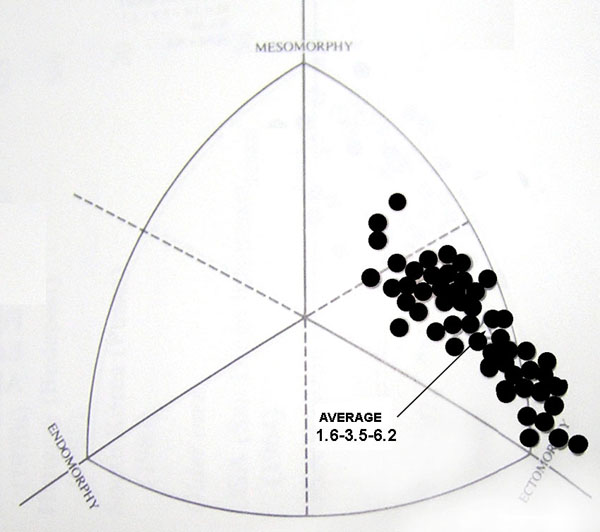
Thanks to a team of South African physiologists led by dr. de Ridder, we already know somatotypes of top African male distance runners. The team measured 49 Africans participating at the African Games 1995. Out of this number, more than 90% runners were black. http://en.wikipedia.org/wiki/Athletics_at_the_1995_All-Africa_Games Later, they added new data from the African Games 2003 for the 3-10 km. http://en.wikipedia.org/wiki/Athletics_at_the_2003_All-Africa_Games
The combined data for 3-10 km from 1995+2003 gave even more ectomorphic numbers, 1.6-2.6-4.2. This indicates a large decrease in ectomorphy during the last decades (Carter 1984; Olympic 3-10 km runners: 1.4-4.2-3.7). To have an idea, how these numbers fit into the distribution of body types in Nilotes and Europeans, we can compare somatotypes of Sudanese Nilotes measured in the 50's with a similarly numerous sample of American university students.
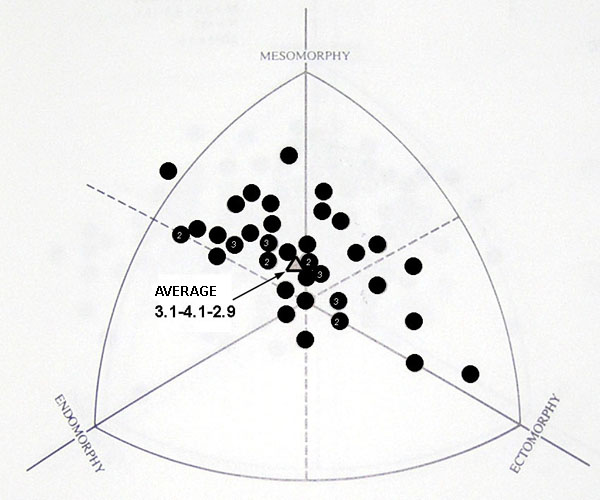
The data indicate that the somatotype of long distance runners (1.6-2.9-4.3) is typical for roughly 50% Nilotes, but only for ca. 10% Europeans. A large study of Štěpnička from the late 70's found a very similar percentage of Czech university students in the meso-ectomorphic part of the graph. However, a very striking phenomena clear from the somatograph is the much wider distribution of body types in Europeans. In other words, Europeans may have more outliers from the average, and thus the average difference between the groups may not tell us enough information about the competiteveness at the ends of the bell curve. A lower range of body types and proportions is typical for those human populations, who were exposed to extreme climatic conditions.
To calculate the athletic difference in the 10 000 m, where interracial differences are the largest, we can further compare the distribution of the optimal height for this distance (165-175 cm) with its distribution among Nilotes and Northern Europeans. Since at least 50% Kenyan Nilotes and Ethiopians are within this height range, while maximally 25% Northern Europeans have a height below 175 cm, the size of the talent pool can be expressed as a ratio of 10:1. If all things were equal (i.e. all runners from the 200-million population of East Africa and the 1-billion white population had the same facilities and motivation to compete), we still could see about one-third white runners among the world's elite. Considering that Southern Europeans are about 5 cm smaller than Northern Europeans, the ratio is rather conservative. Naturally, these are very rough calculations that can't be taken too seriously, but obviously, the difference from the reality is enormous. We should thus look for other than only genetic explanations of the current African dominance.
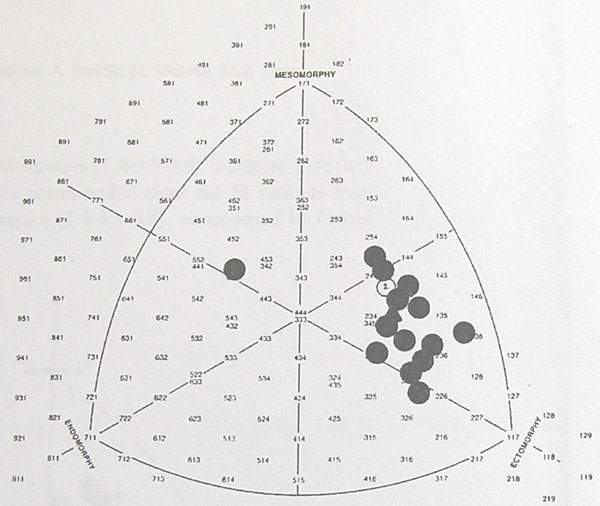
What is even more interesting is the distribution of African somatotypes in middle distances and the marathon. The 800/1500 m average somatotype 1.4-3.4-4.2 already isn't so "typically African", and it may be argued that it is not ideal for the 800 m, which the average body measurements 177,7 cm/62,7 kg also suggest. The weirdest body type - from the African perspective - can be found in marathon runners (1.4-3.9-3.9). The common opinion of athletic fans is probably that the longer the distance, the better the African physical prerequisites for dominance. However, the documented somatotypes of marathon runners clearly indicate that this is not the case. Even marathon runners of the past (Carter 1984; combined sample from OG '60+'68+'76: 1.4-4.4-3.4) had higher mesomorphy and lower ectomorphy than long distance runners (1.4-4.2-3.7). In fact, their somatotype was closer to that of 800/1500 m runners (1.5-4.3-3.6). Why?
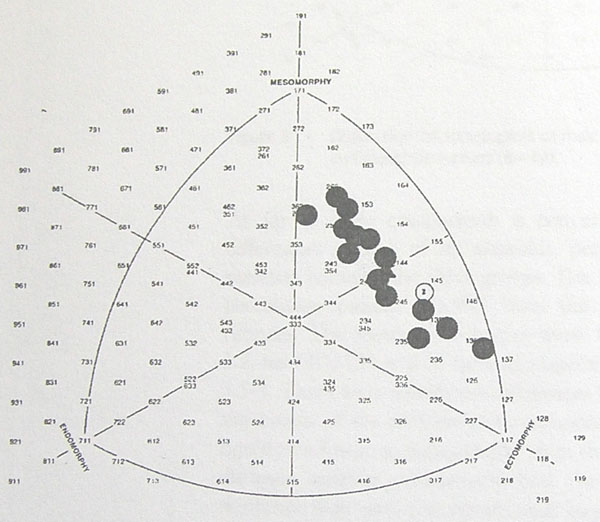
The reason is not difficult to understand, when we look at the data of ultramarathon runners: For example, Pavlik (2003) documented somatotype values 2.5-4.9-3.1 in the participants of an international ultramarathon. The increasing endomorphy+mesomorphy and decreasing ectomorphy can have only one explanation: After ca. 1,5 hour of intense muscular work, glycogen stores in muscles are completely depleted and the organism must start to rely on the production of energy from fats, which needs about 7% more oxygen. As a result, the speed of the runner must inevitably decrease by a similar percentage. Extremely slender runners are thus disadvantaged in the marathon. The only limiting factor for Europeans is the optimal marathon height (ca. 170 cm/60 kg) that results mainly from optimal thermoregulation. The typical marathon runner is thus actually only a miniature of the typical middle distance runner. This can explain, why we still know European, North African and East Asian winners of prestigious marathons - a phenomena that would be unimaginable in the 10 000 m. But how is it possible that Africans flooded not only long distances, but even the 800/1500 m and the marathon?
What historical stats can tell us
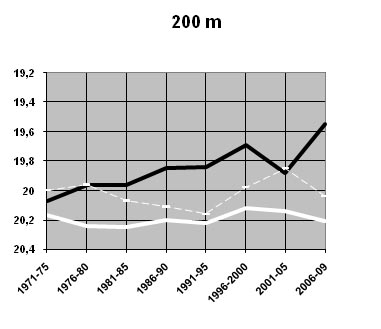
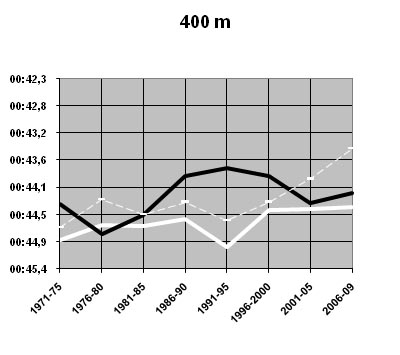
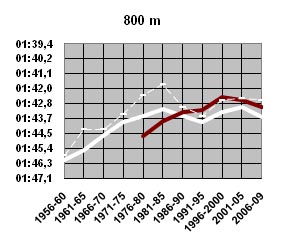
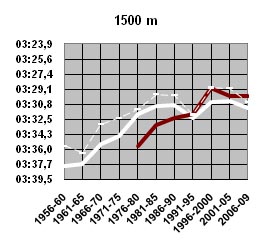
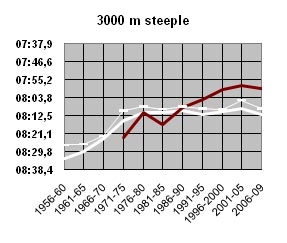
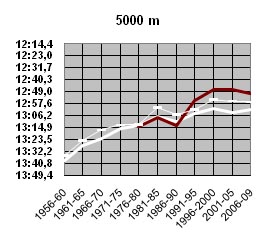
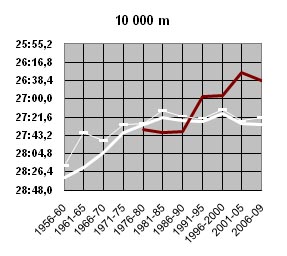
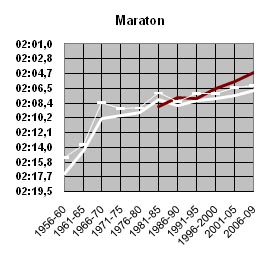
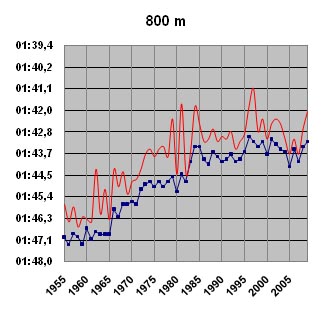
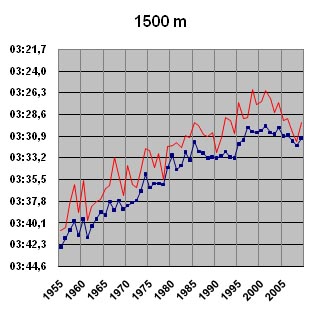
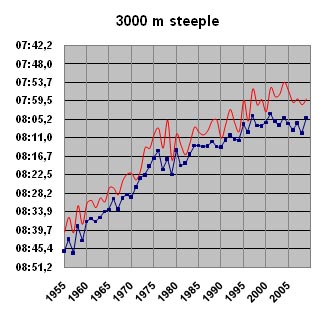
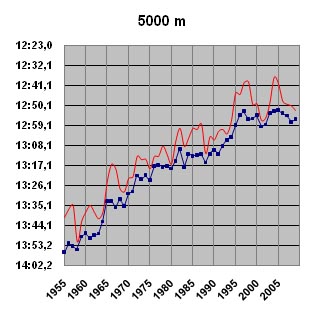
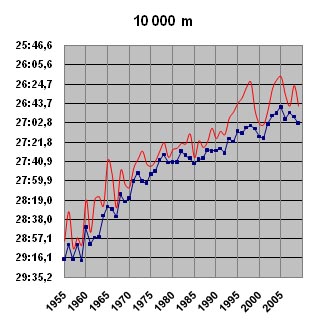
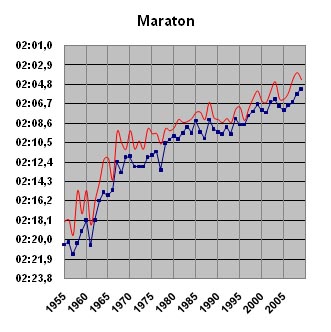
Obviously, the situation we see today on track doesn't reflect the magnitude of interracial physical differences. To investigate the roots of the large discrepancy, we should look for sociological explanations. What about if we compared the rate of development of white runners in the post-war era? Will it differ from the African rate? The graphs below show the average time of top 5 runners within each 5 years according to racial origin (European/white: thick white line, West Africans in the 200-400 m: thick black line, East Africans in the 800 m-10 km: thick brown line). The best time of a white runner (thin white line) is also added. Considering that hand-timed performances are difficult to compare in sprints, the comparison of the 200-400 m begins in 1971.
The striking feature we will find in these graphs is a more or less linear development of white times until late 70's (3000 m steeple) or mid 80's (middle distances, 5-10 km, marathon), respectively, followed by stagnation and later mostly a very deep regression in the late 80's/early 90's, often 10-15 years back! What's especially shocking is the fact that the times in sprints haven't improved virtually at all. The only exception from this trend is the 5000 m and the marathon, but even these distances went through a downfall in the late 80's. This stagnation/regression thus occured just in the time, when African runners started to "flood" the track. A general analysis of the development in track since 1955 confirms these observations. A sudden stagnation is apparent in the 3-10 km in the late 70's and in the 800-1500 m after 1985.
A further analysis of the performances of African runners shows that we normally understand under the term "African emergence" is actually a mixture of three trends that may be mutually independent of each other:
In any case, the fall of times continued until the late 90's, when a partial reemergence began. Considering that in the meantime Africans got the sport onto a higher level, the differences largely persisted. However, even this partial improvement was enough for a radical change in medal stats and the disappearance of East Africans in the 800/1500 m: Between 2000-2004 they have won only 1 out of 8 middle distance titles (whites won 3, North Africans 4). During the recent years, the times have been falling again, both in whites and Africans.
While the regression of white times can explain the African emergence around 1990, the sudden improvement of Africans in mid 90's is much harder to explain. The stellar performances of Komen, Gebreselassie, Tergat, Hissou et al. were simply taken as an expression of the "hidden potential" of the African elite that could not come to light in the past, when the facilities and training conditions were not fair. Yet there are several serious problems with this explanation. First, the skyrocketing of times came within a single season of 1995, and over a single winter of 1995-1996, the ethnic composition of distance events utterly changed. To illustrate this point, I can list annual Top 10 lists between 1992-1997 in two distances, where this change was most marked (1500 m, 5000 m):
It is apparent that in the 1500 m before 1995, Kenyans ran relatively mediocre times by the standards set in the mid 80's (3:32-3:34) and in the 800 m, the situation was similar (1:43-1:45). Nothing showed that we could expect any sensational change in these distances. In the 3-10 km, a slow improvement began (Moses Kiptanui improved WR in the 3000 m steeple by 3 sec. in 1992, Haile Gebreselassie broke Aouita's WR in the 5000 m by 2 sec. in 1994, Ondieki and Sigei markedly improved WR in the 10 000 m in 1993-1994), but the times of the remaining runners didn't change dramatically. The rate of improvement in the 1500 m between 1955-1985 was 0.37 sec./year, in the 5000 m 1.42 sec./year. When we compare it with the trend between 1990-1994, we can say that the 1500 m was in deep agony, and the 5000 m was improving a bit slower than in the past (1.18 sec./year).
Things started to change in 1995, when the first Kenyan got under 3:31, and four runners in the 5000 m broke the 13:00 bareer. The next year, a flood of Moroccans, Kenyans and Ethiopians started to dominate all track disciplines from the 800 m onwards, and the average time of Top 10 in the 5000 m improved by staggering 9.8 seconds within mere 2 years. The range of times within Top 10 also increased, from SD ±3,11 in 1992 to SD ±6,93 in 1997, with the best runner consistenly running much faster than the Top 10 average. Can this dramatic change be explained by the introduction of new training methods to Africa? European coaches and managers started to work in Kenya shortly after 1990, yet the performances of top Kenyans showed either a zero or only a gradual improvement. A curious thing is that even the runners established before 1995 started to rapidly improve only after 1995 (Kemei, Barmasai, Tergat, Kiptanui, Hissou, W. B. Kipketer). Evidently, some epochal change came in 1995 to Africa and hit the whole continent, from Morocco, over Ethiopia to Kenya. What was this epochal thing?
If the dramatic improvements were natural, we could expect that after some time, the rest of the runners would reach the sphere achieved by the best athletes. In the past, it was not rare that an exceptional runner set a world record that was completely out of reach of the majority of the world's elite (Ron Clarke, Peter Snell, Jim Ryun). He showed the limitis of human potential and was a big motivation for others. As a result, they followed him and this "untouchable" time became a standard after 10-15 years. However, nothing of this sort happens today. The times suddenly exploded within 2-3 years, fantastic new world records were set, but with the exception of the marathon (a road discipline), they have improved only cosmetically or not at all since 1998. Furthermore, the average elite athlete hasn't also improved at all (In the 10 000 m, the difference between the best time and Top 10 average decreased, but only because the stellar times between 1995-1998 had been achieved by 2-3 athletes every year.). If the human limits really lie so high as times of the prominent African runners showed, why doesn't the rest follow them even after 15 years? In fact, the Top 10 average in track distance races markedly declined during the recent years . The decline is especially marked in the 800/1500 m, where current performances don't differ much from those run in 1985. Considering the alleged huge overpressure of running talents in Africa, such a development is very strange and makes no sense. However, it makes perfect sense, if the rapid improvement in the mid 90's was unnatural and achieved by drugs that are now being better detected. This suspicion is being recently confirmed by the growing number of caught athletes, especially from Morocco.
These cases ("tips of the iceberg", as usually) show that drug abuse is rampant in Morocco and Kenya, and is definitively present in Algeria and Ethiopia. Romantic myths about natural talents from Africa can't withstand the reality check. The advancement in doping tests will hopefully soon show, if we were not victims of an epic sports fraud.
Blacks are faster and whites are stronger?
Despite the apparent dominance of black runners and also bodybuilders, white athletes still dominate disciplines that lay premium on upper body strength like athletic throws, weighlifting, powerlifting or wrestling. It seems that this phenomenon can also be explained in biological terms: Scientific research shows that while West Africans may have more developed muscles of limbs, whites tend to have more muscle on the trunk. But muscles of the trunk are a limiting factor in strength disciplines. Moreover, long arms and legs (i.e. long levers) are bad for weightlifters, because they influence the amount of produced force. If we take into consideration that the best weightlifters have trunk/height ratio about 54-55%, it is no wonder that blacks have little chance in lifting. Their linear stature is actually the absolute opposite of a weighlifter's quadratic physique. The performance in lifting also depends on other factors like muscle architecture or the place of the attachment of tendons on the bone, but racial differences of this sort haven't been extensively studied so far.
It is true that longer arms of blacks can be advantageous in throws like discus, but they may be disadvantaged by relatively long legs and shorter trunk, a factor impeding stability and total body strength. Still, there should be no reason, why blacks couldn't excel in the javelin throw, where strength compromises with speed and technical factors. Since performance in the javelin is most influenced by releasing speed, the answer may lie here. In any case, further research in this area would be necessary, but it is quite foolish to expect that some white researchers would be interested in it. One must take into consideration that strength is markedly influenced by the level of physical activity and such differences may not be detectable in untrained persons. In fact, I have found only one study that tried to give an answer to this question (Fields, Bemben, Mayhew 1997), but the results were not too illuminant. The sample was not well chosen (white subjects were almost 9 kg lighter and had 4,4 kg less lean muscle tissue) and most of the discovered results was "non-significant". Black persons performed significantly better in leg press (164,9 vs. 156,8 kg), but that's not surprising. However, it's interesting to note that despite having less lean muscle tissue, whites performed "non-significantly" better in bench press (91,2 vs. 84,9 kg), which confirms the findings about different muscle mass distribution. Whites also produced more strength on the cross-sectional area of muscle (cm²), which may suggest more advantageous lever system, among some other things. In any case, it would be useful to continue in this research, because the differences in strength between blacks and whites must be abyssal. In 2003, there was only one black powerlifter competing at the world championship in middle or heavy cathegories (Tony Harris from USA) and he finished 4th in the 110 kg cathegory, 80 kg behind the winner and 177,5 kg behind the strongest man at the competition, which would mean 22nd place total. It is worth note that the number of black powerlifters was higher in late 90's, but they began to disappear, when Russians and Ukrainians showed on the scene and practically gained control of the sport.
In connection with this topic it is important to notice the naive opinions of white people, who often confuse the "athletic appearance" of blacks with strength and athletic abilities. In fact, the ripped muscles that we see on their bodies have nothing to do with any athleticism and result from less levels of body fat that is furthermore concentrated internally or in the subscapular region (below shoulder-blade) and effectively reveals "athletic proportions" with wider shoulders and narrower hips. This can be benefical in body building or in modeling, but it certainly has no influence on the movement of a barbell.
The debate about „black athletic superiority“
As we saw in previous paragraphs, Arthur Ashe is right. West African populations really posess a marked advantage in sprinting and jumping, factors that have a significant impact on performance in many sports. The other thing is that these predispositions play a decisive role only in sprinting and jumping or other related sports, and not in team sports, where an individual performance depends on a wide variety of factors. Thus it is not surprising that muscle fiber composition in these games is not too much different from the average. The competing athlete must reach a certain level of overall physical condition that is sufficient for the maximal expression of his psychomotor skills. Being reasonably good in all physiological demands is better than to daze in one or few and fail in the rest. Some physical and physiological differences may contribute to detectable overrepresentation of certain ethnic groups at certain, very specific positions in the game, but due to the extreme variability of performance factors it's extremely risky to start any "genetic" debate concerning the game in general. Moreover, the same physical tests that showed superiority of black children in sprints found no differences in tests of agility (sprints with changes of direction), which probably results from the long-legged African physique that impairs stability and coordination. This finding is very interesting, because team sports (especially such like football/soccer, handball, rugby or even American football) rely more on the combination of speed and agility rather than on pure speed. Thus it is not desirable to imply results of flat sprints on the "game speed". Speed with changes of direction and linear sprinting speed are two very different abilities.
The second main cause of the overrepresentation of blacks in American sports is socioeconomic. Sports gave them a chance to create their own culture in the American society. Although it is clear that black basketballers generally have important physiological and also physical advantages (e.g. long limbs), the situation in modern basketball tell us that the cause of black dominance in NBA will be close to the cause of their dominance in track and field. Although American media may still continue in their agitation about "natural athleticism" of black basketball players, it's a clear fact that their superior genes begin to degenerate, when they are now exposed to serious competition from Europe.
Let's now take a quotation from an internet forum, where Mr. Entine presented "well-researched" data concerning vertical jump height expressed as the percentage of the athlete's height (from TABOO, p. 252):: "Top volleyball players [in America] top out at 50 percent or so. NBA players regularly exceed that with Spud Webb jumping more than 66 percent of his height -- 42 inches [107 cm] (he's 5 feet, 7 inches [170 cm/61 kg]). There is a test called the Sargent test, which measure jump and reach. The greatest Sargent result ever was recorded by former Utah Jazz star Darrell Griffith (aka Dr. Dunkenstein) who jumped 48 inches [122 cm] - that's 63 percent of his 6-4 [193 cm] frame. No white and certainly no Asian has ever come close."
I add that dr. LeVeau and dr Krugh, who measured Michael Jordan's jumping ability, found a much more modest number - 35,9 inches (91,3 cm). However, when he was tested during a jump from running, he achieved 45,8 inches (116 cm). I do hope that now it's clear to you, where all those incredible numbers cited by Entine come from. They are mystifications often spread by NBA stars and don't concern a true vertical jump (the Sargent test), but "a dunk jump", i.e. jump from running. In fact, according to one trainer, who seriously measured NBA players, they usually achieve results between 70-85 cm (28-34 in). Why not more? Count with me: An average NBA player measures 200 cm (6'7), which means that he has a vertical reach of about 255 cm (8'4). To touch the hoop of the basket, he needs a very mediocre jump of 50 cm (1'8). If you take an average basketball player with a decent jump of, say, 75 cm, it means that during a jump from running he jumps about 100 cm and has hands approximately 355 cm above the ground, i.e. 50 cm above the hoop.
The better anaerobic abilities of blacks - together with their somewhat faster motor development - may give them an important advantage during adolescence, because they can reach a sufficient performance level significantly faster than white kids. This probably explains, why black kids in racially mixed countries succeed in basketball (and some similar sports) more than their white contemporaries (and why the best white players come outside such countries). Naturally, due to their overall predispositions (and the fact that they live in US, the country, where NBA is played) black players will probably prevail in the game even in the future, but some people still can't understand that basketball is not sprinting. Team sports are much more variable than individual sports. Furthermore, the most important factor in basketball is body height, not jumping or sprinting ability.
If there is any team sport, where jumping ability is really critical, then it's volleyball. Top class volleyball players regularly jump 90-100 cm (and they are white). But even here the comparison is not easy and fair: volleyball players usually test vertical jumps with a 3-4 step advance, which increases the final height by cca 10-15 cm. This means that US volleyball team that achieved an average of 94,2 cm before 1984 Olympics actually jumped only 80-85 cm. But this is still higher than the presumable average of NBA players.
Eventually, we get to the widespread claims about the black domination in athletics that deserve a special chapter.
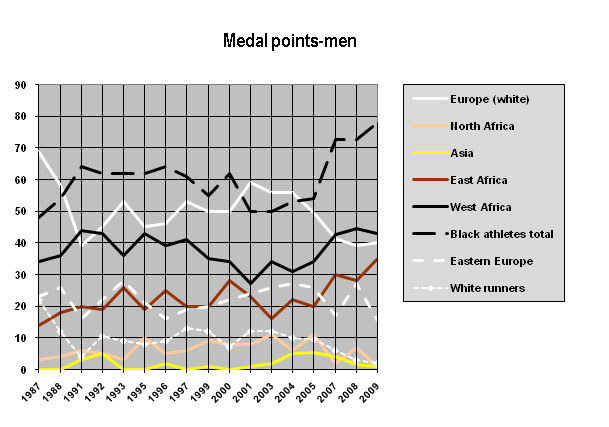
"The black domination in track and field"
In reality, the era of "black dominance" lasted from 1991 to 2000. However, when we furthermore separate West African and East African blacks, there can be no talk about any "black domination" at all. The apparent decline of European athletics at this time was not caused only by the emergence of African runners, but also by the changed political and economical situation in post-communistic East European countries. When we look at medal statistics, we can see that at the same time the trend changed its course and when combined with a weak generation of North American athletes (mainly jumpers) it was responsible for a declining curve of black medal winners after 1996. In 2001, the medal bilance of white athletes returned back on the level of 1988 and the bilance of athletes of West African ancestry fell on the lowest level since the mid 80's. Between 2001-2004, we can openly speak about "the white domination in track and field". A sudden change in this trend appeared in 2005, when the performances of white athletes started to fall rapidly. The changes thus seem to be periodical and are largely influenced by the actual state of field events in the former Eastern Europe. "Black athletes" collected almost two-thirds of all medals at the World Championship in Berlin 2009, while whites one-third. Yet the unparalleled increase in the number of black medal winners can be mainly attributed to the downfall of North African runners, decimated by recent doping affairs. Nevertheless, the performance of white runners in Berlin 2009 (one silver medal: Wariner in the 400 m) was the worst in the whole athletic history.
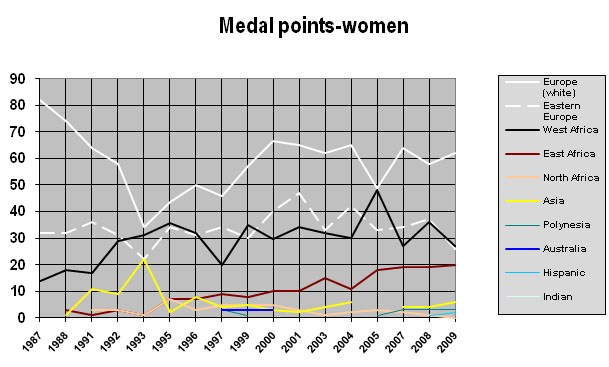
As for female athletes, no consistent, dramatic changes in the overall picture have been visible since 2000. The most striking trend is a gradual improvement of East African women. Performances of Eastern European women have been slowly falling since 2004, similarly like in Eastern European men, which suggests that it is a common phenomena in this part of Europe.
Sources Black sprinters and the anthropology of West African populations
Kenyans and Ethiopans
Black South Africans
General articles
Any comments, corrections or suggestions?
|
|||||||||||||||||||||||||||||||||||||||||||||||||||||||||||||||||||||||||||||||||||||||||||||||||||||||||||||||||||||||||||||||||||||||||||||||||||||||||||||||||||||||||||||||||||||||||||||||||||||||||||||||||||||||||||||||||||||||||||||||||||||||||||||||||||||||||||||||||||||||||||||||||||||||||||||||||||||||||||||||||||||||||||||||||||||||
 An
answer to this question is not easy. Elite athletes are namely more or
less extreme products of genetic variability; they are exceptional just
because they differ from the average. Moreover, many important factors are
necessary to realize sports potential, from cultural background,
motivation, social conditions to facilities and sports tradition in some
countries. In any case, athletic statistics are impressive: In 2009, we would have to go to
the 430th place in all-time lists to find the best time of a white
sprinter in the 100 m. In 1984 Marian Woronin ran this distance in 10,00
and the same value has an Asian record held by Koji Ito since 1998. At the
same time, the 10 sec. bareer has been broken more than 430 times by
69 black
sprinters (2009). The only non-African with a sub-10.00 time is Patrick
Johnson, an Australian of Irish-Aboriginal origin. Recently, times of white runners have also disappeared
from top rankings in long distances like 5-10 km. The Top of 50 in the 10
000 km is impressively dominated by 46 East Africans and 3 North Africans.
The last non-African world record holder at this distance, Mexican runner
Arturo Barrios, is on the 50th place, and the best European, Antonio
Pinto from Portugal, is 59th, with an almost 1-minute loss to the best 10
000 m runner, Kenenisa Bekele from Ethiopia.
An
answer to this question is not easy. Elite athletes are namely more or
less extreme products of genetic variability; they are exceptional just
because they differ from the average. Moreover, many important factors are
necessary to realize sports potential, from cultural background,
motivation, social conditions to facilities and sports tradition in some
countries. In any case, athletic statistics are impressive: In 2009, we would have to go to
the 430th place in all-time lists to find the best time of a white
sprinter in the 100 m. In 1984 Marian Woronin ran this distance in 10,00
and the same value has an Asian record held by Koji Ito since 1998. At the
same time, the 10 sec. bareer has been broken more than 430 times by
69 black
sprinters (2009). The only non-African with a sub-10.00 time is Patrick
Johnson, an Australian of Irish-Aboriginal origin. Recently, times of white runners have also disappeared
from top rankings in long distances like 5-10 km. The Top of 50 in the 10
000 km is impressively dominated by 46 East Africans and 3 North Africans.
The last non-African world record holder at this distance, Mexican runner
Arturo Barrios, is on the 50th place, and the best European, Antonio
Pinto from Portugal, is 59th, with an almost 1-minute loss to the best 10
000 m runner, Kenenisa Bekele from Ethiopia. 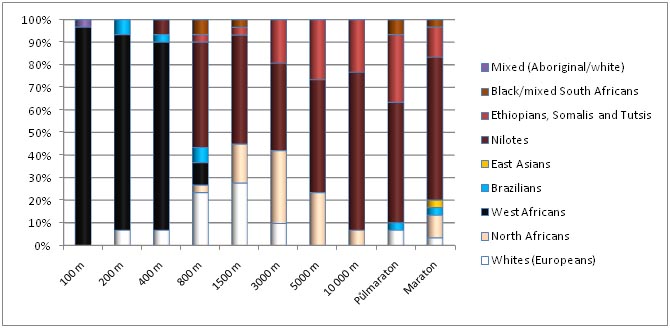
 Anthropological
studies done in African-Americans (that are primarily of West African
origin) generally show – in comparison with white Americans – a tendency
towards relatively longer legs (trunk/height ratio close to 51%), narrower
hips, relatively longer and slender calves and generally less body fat.
This tendency is even more pronounced in indigenous West African
populations (trunk index close to 50%), which indicates that American
blacks were exposed to certain mixing (estimated at 20%.). In contrast with their African
ancestors they are significantly taller a heavier, undoubtedly due to
better nutrition. Whites, on the other hand,
have shorter legs (trunk/height ratio ~52,2%) and arms, with wider hips
and wider, more volumnious chest. It is also a well-known fact that young
African-Americans have higher testosterone levels (as much as 19 percent
more than in young white men), which can contribute to higher agressivity
and competitiveness. Further, higher bone (+5-20 percent) and body density
was repeatedly measured in American blacks.
Anthropological
studies done in African-Americans (that are primarily of West African
origin) generally show – in comparison with white Americans – a tendency
towards relatively longer legs (trunk/height ratio close to 51%), narrower
hips, relatively longer and slender calves and generally less body fat.
This tendency is even more pronounced in indigenous West African
populations (trunk index close to 50%), which indicates that American
blacks were exposed to certain mixing (estimated at 20%.). In contrast with their African
ancestors they are significantly taller a heavier, undoubtedly due to
better nutrition. Whites, on the other hand,
have shorter legs (trunk/height ratio ~52,2%) and arms, with wider hips
and wider, more volumnious chest. It is also a well-known fact that young
African-Americans have higher testosterone levels (as much as 19 percent
more than in young white men), which can contribute to higher agressivity
and competitiveness. Further, higher bone (+5-20 percent) and body density
was repeatedly measured in American blacks. 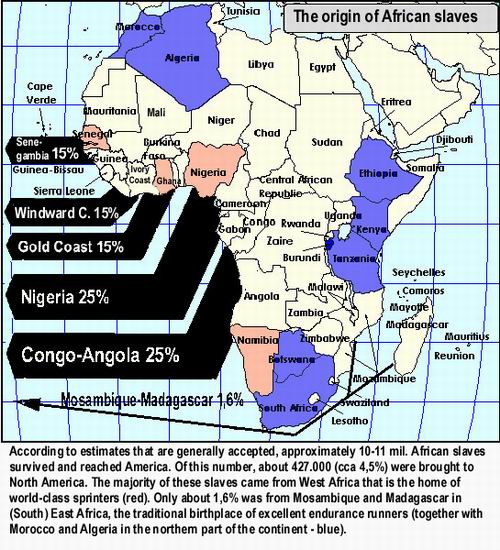
 The conclusions of the studies listed above seem to indicate that East
Africans are markedly better endurance runners than Europeans. However,
can their better running economy really explain the abyssal differences in
today's track? The difference in performance between the best African and
the best European in the 5000 m is not even remotely 10% (76 sec.), as
Danish studies would suggest, but only 17 sec. (=2%), Furthermore, the
white population of USA that is approximately as numerous as the countries
of East Africa together, was able to produce three sub-13:00 runners in
the recent years.
The conclusions of the studies listed above seem to indicate that East
Africans are markedly better endurance runners than Europeans. However,
can their better running economy really explain the abyssal differences in
today's track? The difference in performance between the best African and
the best European in the 5000 m is not even remotely 10% (76 sec.), as
Danish studies would suggest, but only 17 sec. (=2%), Furthermore, the
white population of USA that is approximately as numerous as the countries
of East Africa together, was able to produce three sub-13:00 runners in
the recent years. 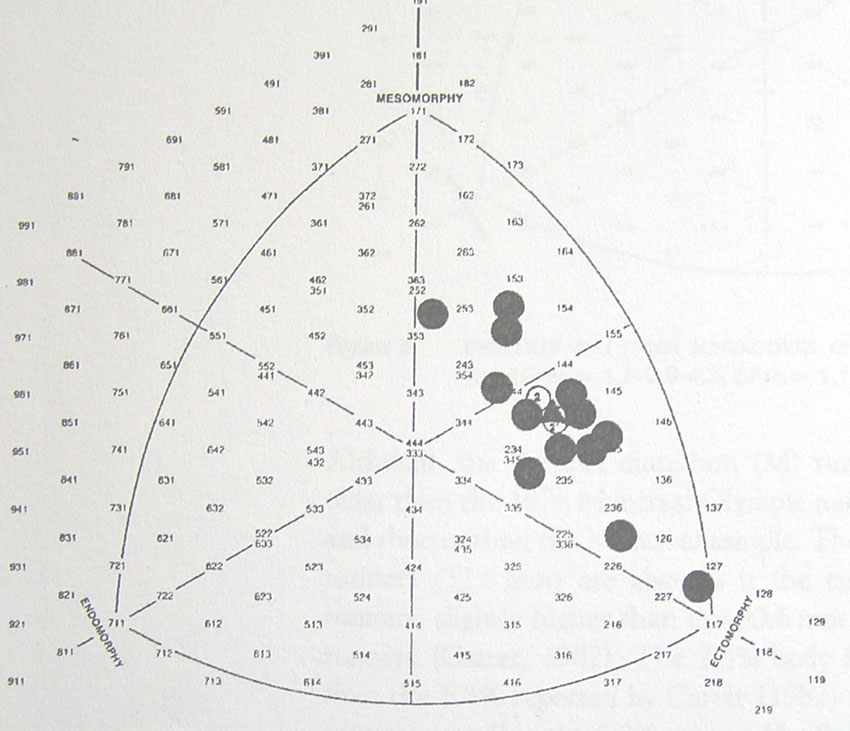

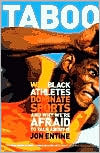 A
book called TABOO:Why black athletes dominate
sports and why we´re afraid to talk about it that was
published in 2000 in the United States, caused a
stir. Its author, Jon Entine, a former
TV producent, who once successfully collaborated at a TV document of NBC
The Black Athlete: Truth and Fiction, quotes words of tennis legend
Arthur Ashe, who expressed to such a question short time before his death:
„The results are excellent.
Nothing sort of stellar. Culture can't explain it. I must believe that
there is something that gives us – blacks – an edge.“
No wonder that books of this sort are
published in the overseas, where black sportsmen make up about 80 percent
of NBA, 65 percent of the National Football League and roughly one third
of the baseball MLB, despite that blacks make up only 13 percent of the
North American population. Frankly, reading TABOO was a very memorable
experience for me. As one could expect from a
book written by a journalist, science is secondary; the primary intention
is to catch the attention in the public by a sensational and provocative
topic. Therefore, unpleasant facts are carefully eliminated and the main
thesis is supported by a goulash of effective half-truths and skilfully
darned gaps. Furthermore, TABOO contains virtually no data and the author
probably plays a game with the reader, if he finds any reasonable
conclusion under tons of worthless lumber. If I didn't get it for free
from my friend, I would return it back. But back to our topic.
A
book called TABOO:Why black athletes dominate
sports and why we´re afraid to talk about it that was
published in 2000 in the United States, caused a
stir. Its author, Jon Entine, a former
TV producent, who once successfully collaborated at a TV document of NBC
The Black Athlete: Truth and Fiction, quotes words of tennis legend
Arthur Ashe, who expressed to such a question short time before his death:
„The results are excellent.
Nothing sort of stellar. Culture can't explain it. I must believe that
there is something that gives us – blacks – an edge.“
No wonder that books of this sort are
published in the overseas, where black sportsmen make up about 80 percent
of NBA, 65 percent of the National Football League and roughly one third
of the baseball MLB, despite that blacks make up only 13 percent of the
North American population. Frankly, reading TABOO was a very memorable
experience for me. As one could expect from a
book written by a journalist, science is secondary; the primary intention
is to catch the attention in the public by a sensational and provocative
topic. Therefore, unpleasant facts are carefully eliminated and the main
thesis is supported by a goulash of effective half-truths and skilfully
darned gaps. Furthermore, TABOO contains virtually no data and the author
probably plays a game with the reader, if he finds any reasonable
conclusion under tons of worthless lumber. If I didn't get it for free
from my friend, I would return it back. But back to our topic.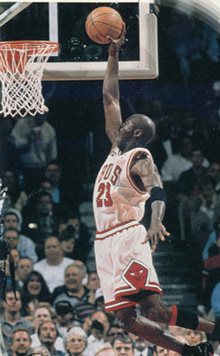
 We
don´t have to count numbers of statistics to find out that the
differences in women are less than in men. Why? Firstly, cultural
factors limit the participation of African women, but this situation
recently changes for the better. Further, this difference results from
the nature of sports as a substitution for men´s combats. Therefore,
women are less „ambitious“ in sports than men and the pool of athletes
is deprived of potential tailents that preferred other career.
Anthropological differences between women of different races are
smaller as well: Women produce 20-times less levels of testosterone
(thus they also have less muscle and in all sports, where strength
plays a role, the differences are smaller, because strength can be
trained) and, on the contrary, a female hormone estrogene supports the
formation of very similar levels of fat. By the way, the interracial differences in the length of limbs
may be smaller as well. And
eventually, the racial statistics are complicated by doping. The use
of male hormones and anabolic steroids causes dramatical improvement
of performance in female athletes.
We
don´t have to count numbers of statistics to find out that the
differences in women are less than in men. Why? Firstly, cultural
factors limit the participation of African women, but this situation
recently changes for the better. Further, this difference results from
the nature of sports as a substitution for men´s combats. Therefore,
women are less „ambitious“ in sports than men and the pool of athletes
is deprived of potential tailents that preferred other career.
Anthropological differences between women of different races are
smaller as well: Women produce 20-times less levels of testosterone
(thus they also have less muscle and in all sports, where strength
plays a role, the differences are smaller, because strength can be
trained) and, on the contrary, a female hormone estrogene supports the
formation of very similar levels of fat. By the way, the interracial differences in the length of limbs
may be smaller as well. And
eventually, the racial statistics are complicated by doping. The use
of male hormones and anabolic steroids causes dramatical improvement
of performance in female athletes.